

The new SightLab Dashboard (available as of SightLab 2.8.0) is designed to make it easier to explore, organize, and launch everything in your SightLab workspace from one place. Instead of digging through folders manually, you can browse projects, open example scripts, launch tools, search across content, view an asset browser, and manage your setup through a single visual interface.
Whether you are starting a new study, revisiting an old project, or looking for a feature example to build from, the dashboard acts as a central hub. It brings together projects, experiment templates, apps, favorites, assets, and downloadable content into a card-based layout that is much easier to scan and use than a traditional file tree.
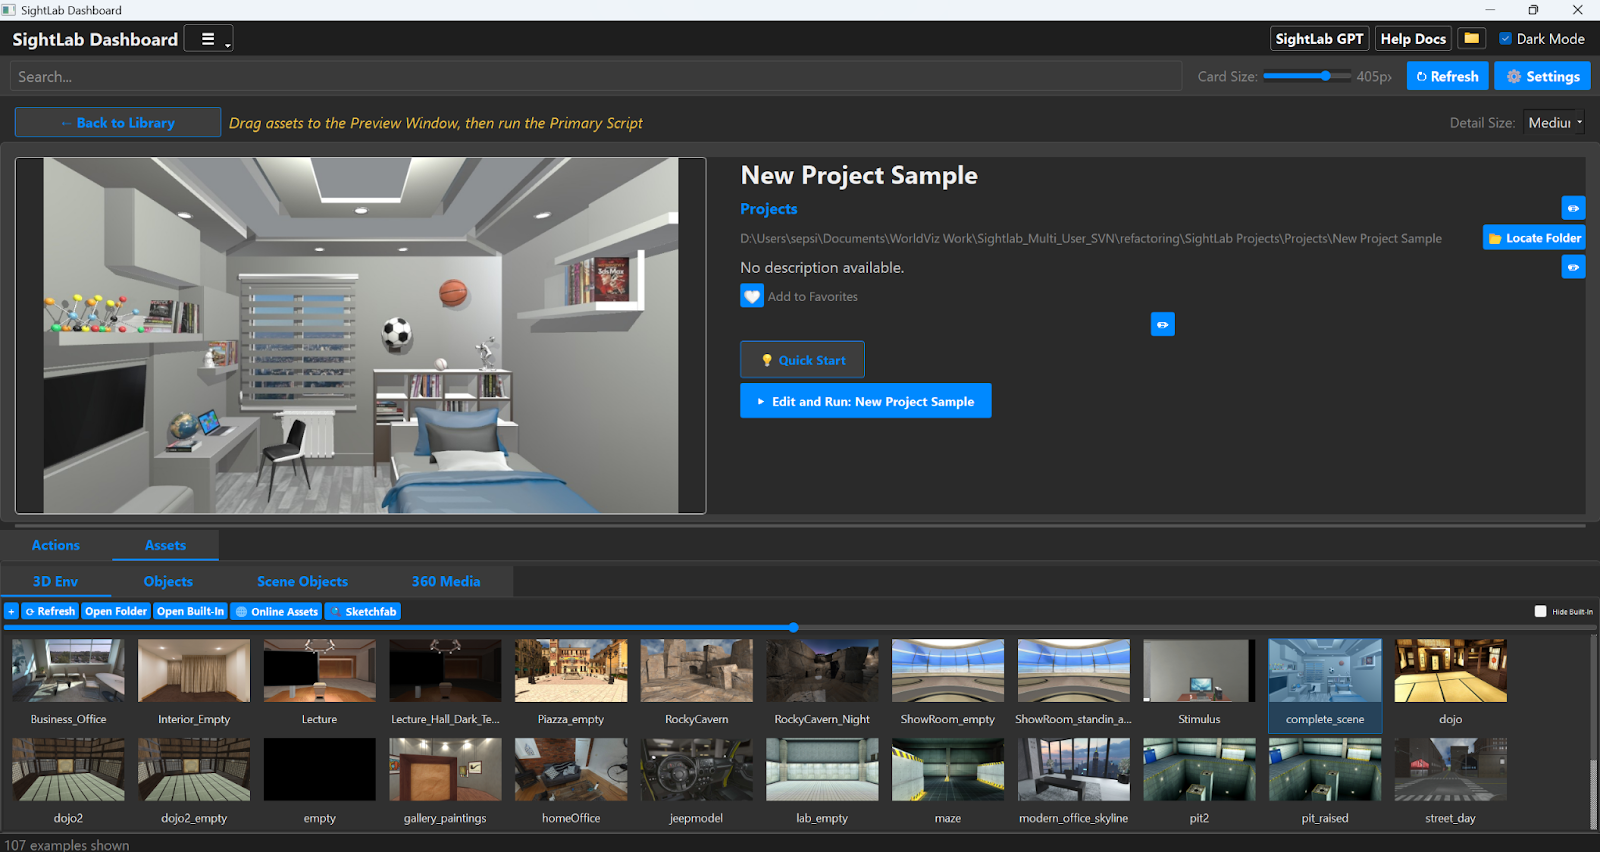
To open the dashboard, launch SightLab Dashboard.py from the workspace root (or from the Desktop shortcut for “SightLab2”. Once it opens, you’ll see a clean interface with a header bar, toolbar, tabs, and a main grid of cards.
At the top, the header provides quick access to useful resources such as the SightLab GPT, and the Help Docs site. There is also a Dark Mode toggle, and the preference is saved automatically.
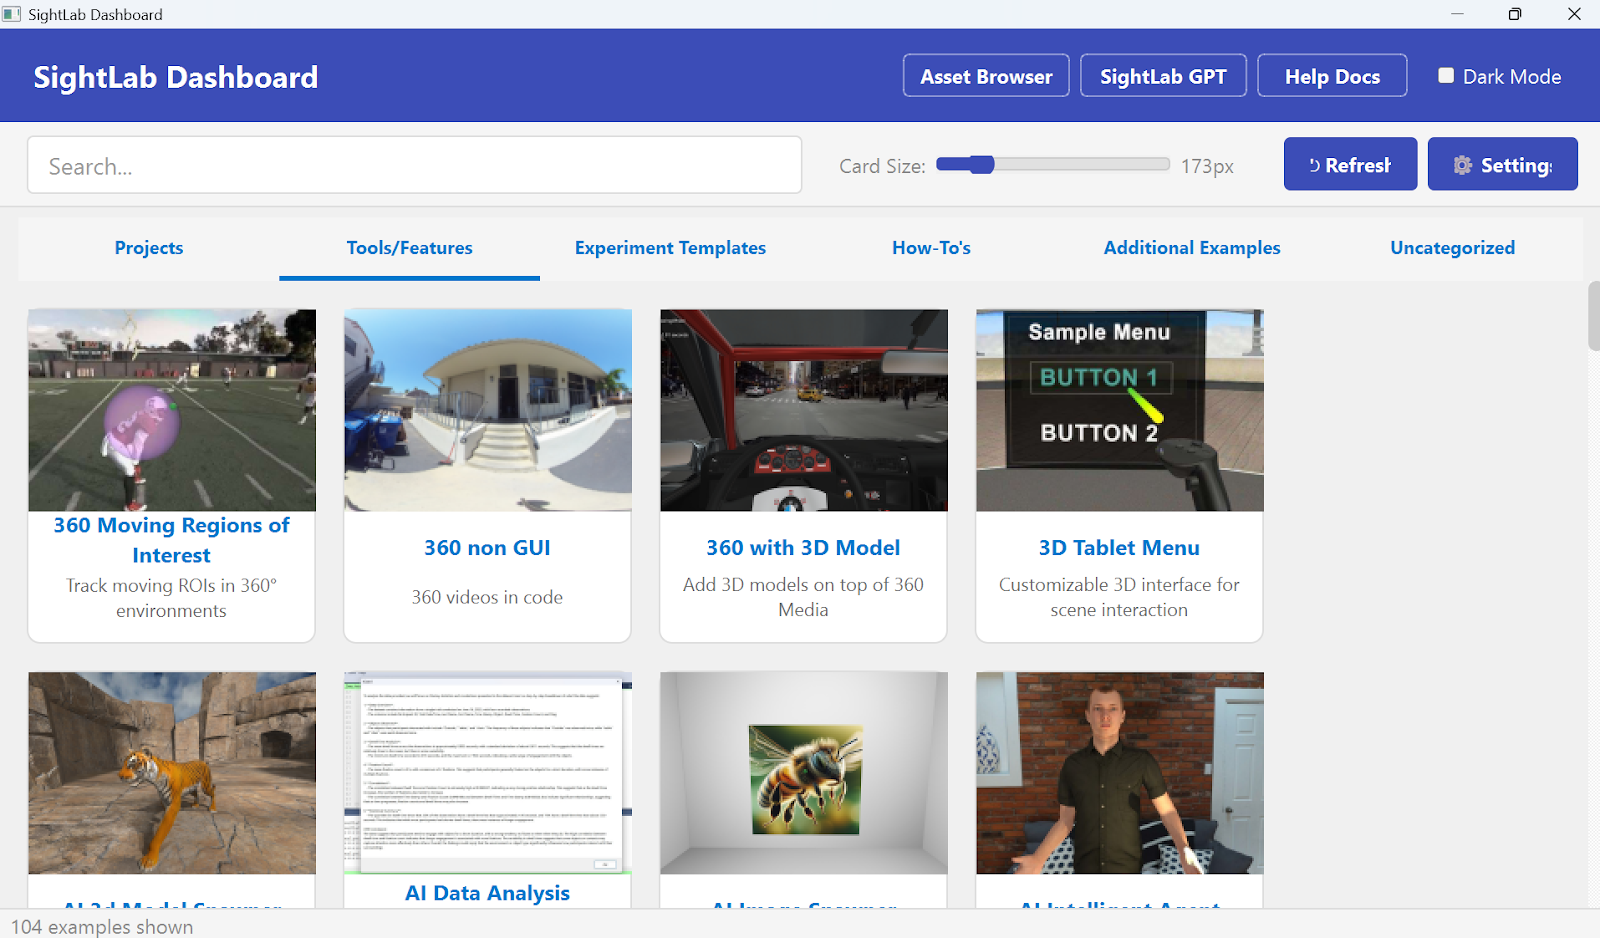
Just below that, the toolbar gives you a few controls you’ll likely use often. The search bar lets you search across titles, descriptions, tags, and categories. When you type into it, the dashboard temporarily replaces the tab view with a unified set of search results, which is especially helpful when you are not sure where a project or example lives. You can also adjust the card size slider to make thumbnails larger or smaller, hit Refresh to rescan the filesystem, or open Settings to configure key paths.
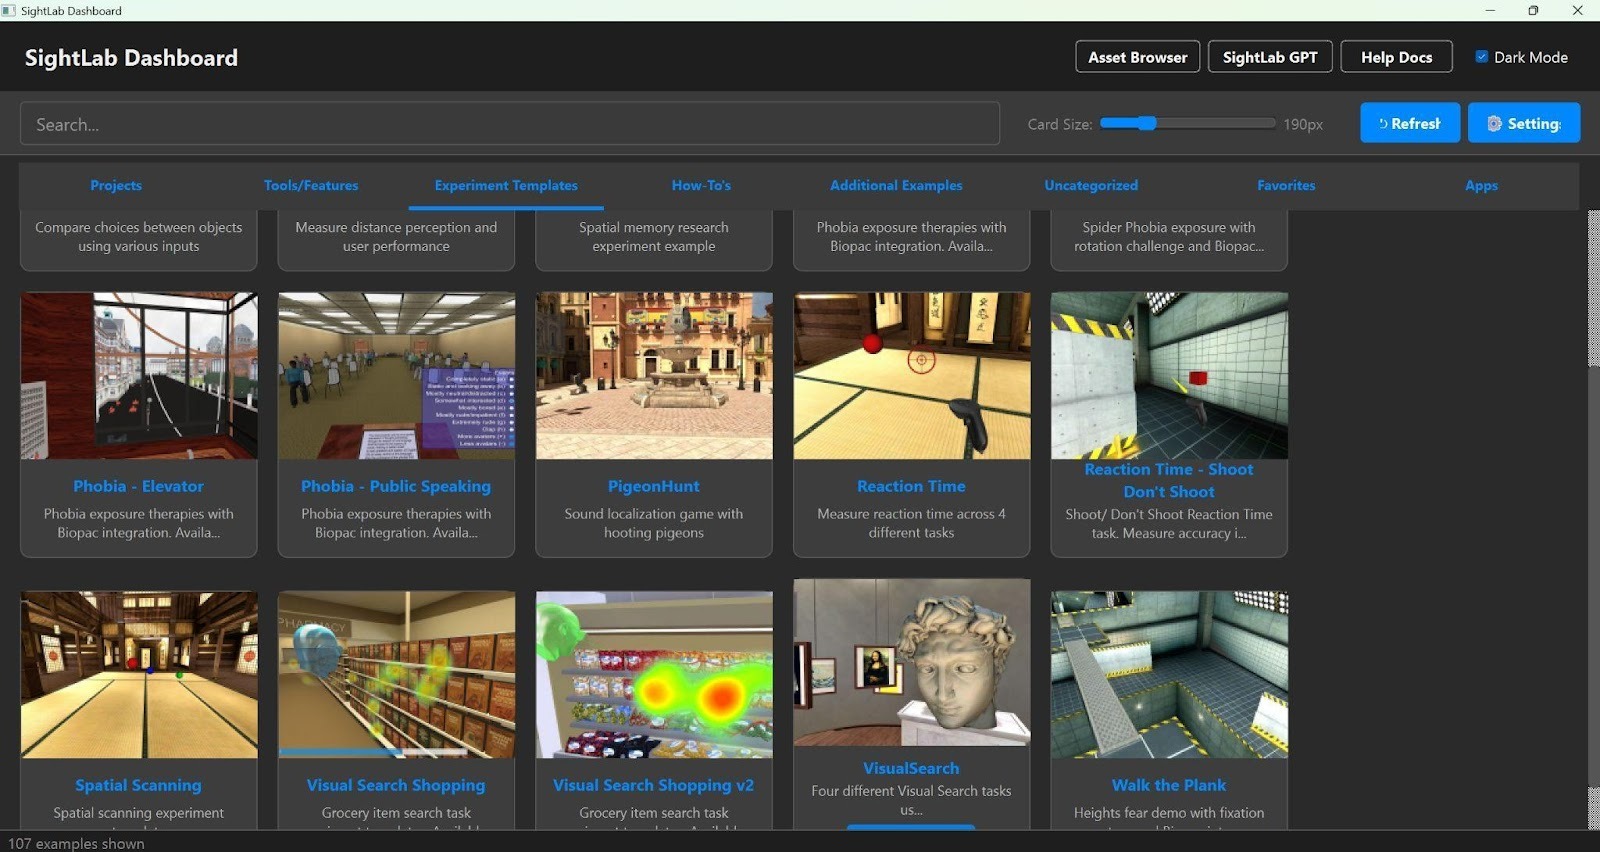
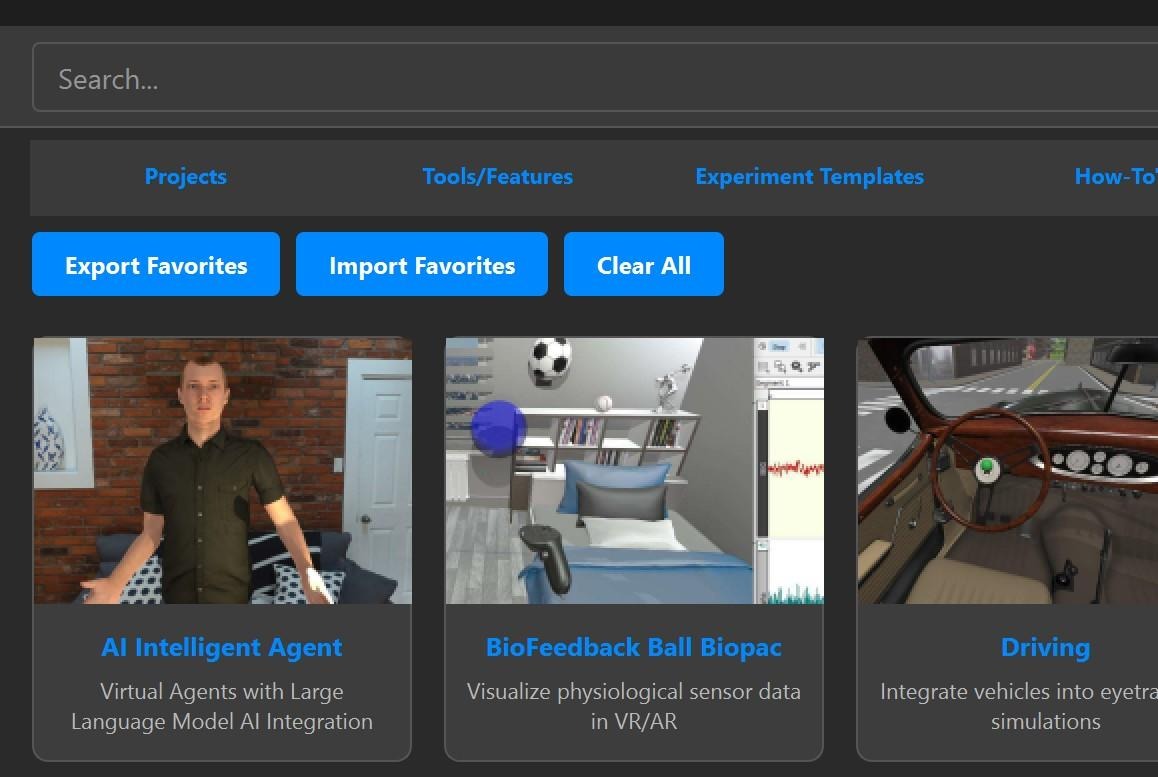
The dashboard is organized into several tabs, each meant to help you find a different kind of content. The Projects tab shows your own SightLab projects (and create new ones), while Tools/Features, Experiment Templates, and Additional Examples help you browse built-in examples, sample workflows and more demos. There is also an Uncategorized tab for items that haven’t been assigned a category yet, a Favorites tab for items you want to save for quick access, and an Apps tab for launching external tools like Vizard and Inspector.
This structure is especially useful for new users because it makes the platform feel more discoverable. You can explore by category if you are browsing, or jump directly to what you need if you already know what kind of experiment or tool you want to open.
The main content area uses a card grid. Each card shows a thumbnail, title, and short description. Left-clicking a card opens its Detail Page, while left-clicking a group card lets you move deeper into a category or folder. Breadcrumb navigation appears at the top so you can easily jump back to higher levels.
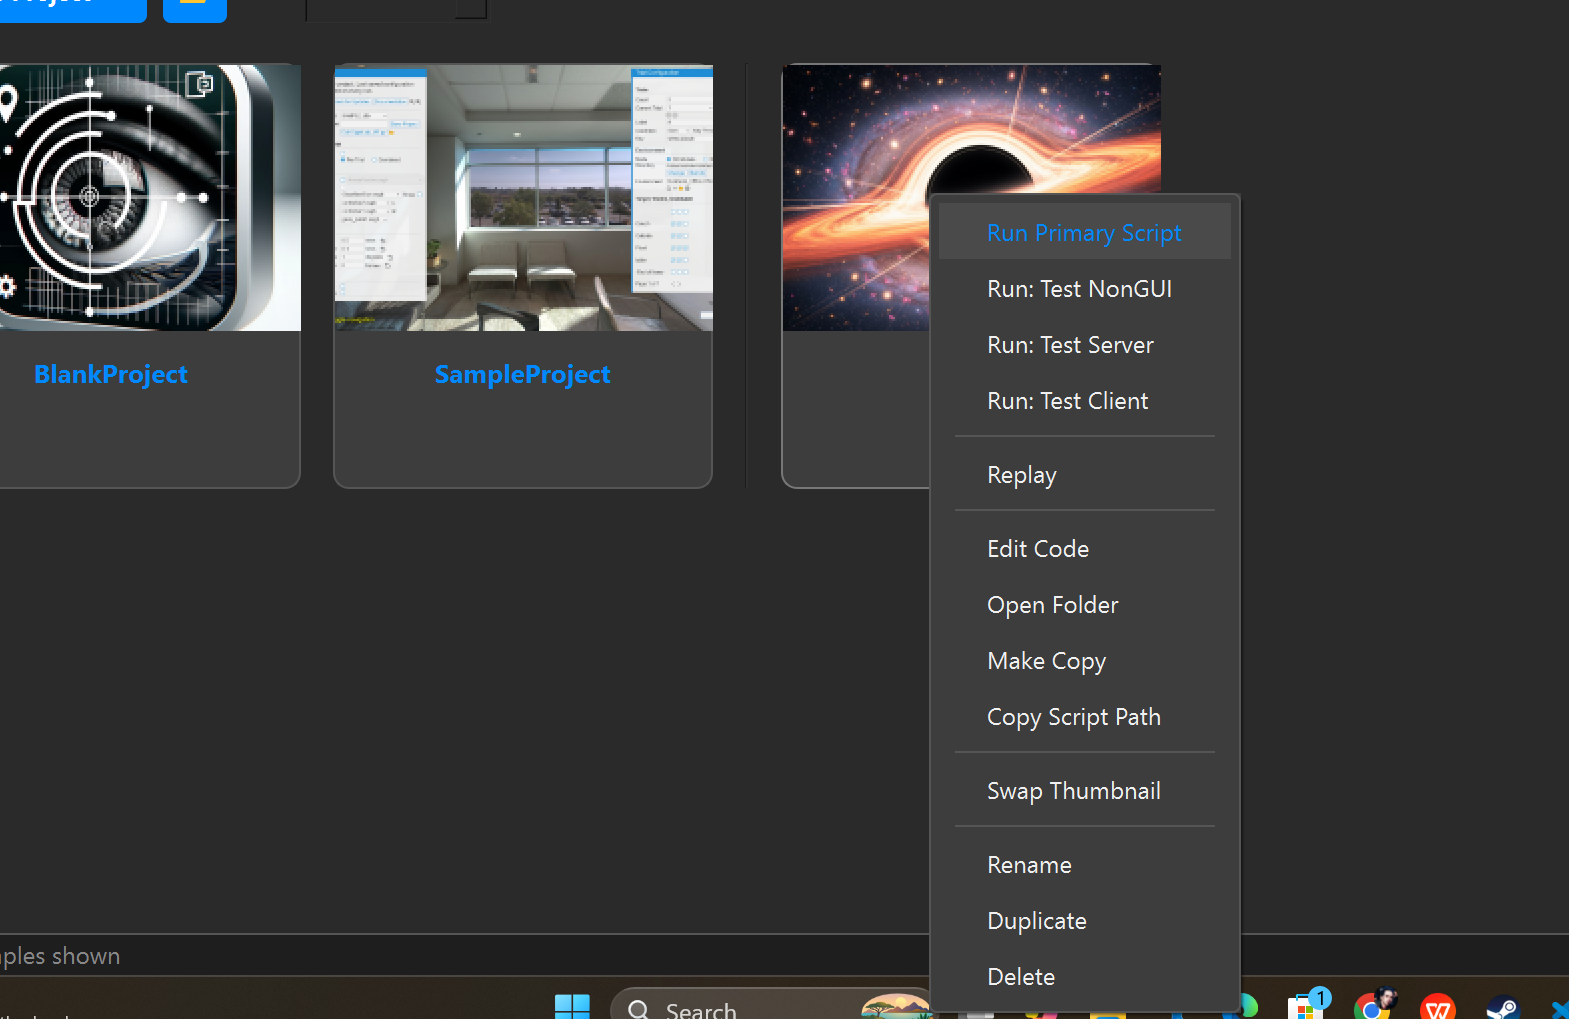
Right-clicking a card opens a context menu with quick actions. Depending on the item, you may be able to run the primary script, launch alternate scripts, replay a session, edit code, open the containing folder, make a copy, copy the script path, open documentation, or swap the thumbnail. Project cards may also allow rename, duplicate, and delete actions.
This makes the dashboard useful both as a launcher and as a lightweight project manager. You can stay in one interface for most of the day-to-day tasks involved in working with SightLab content.
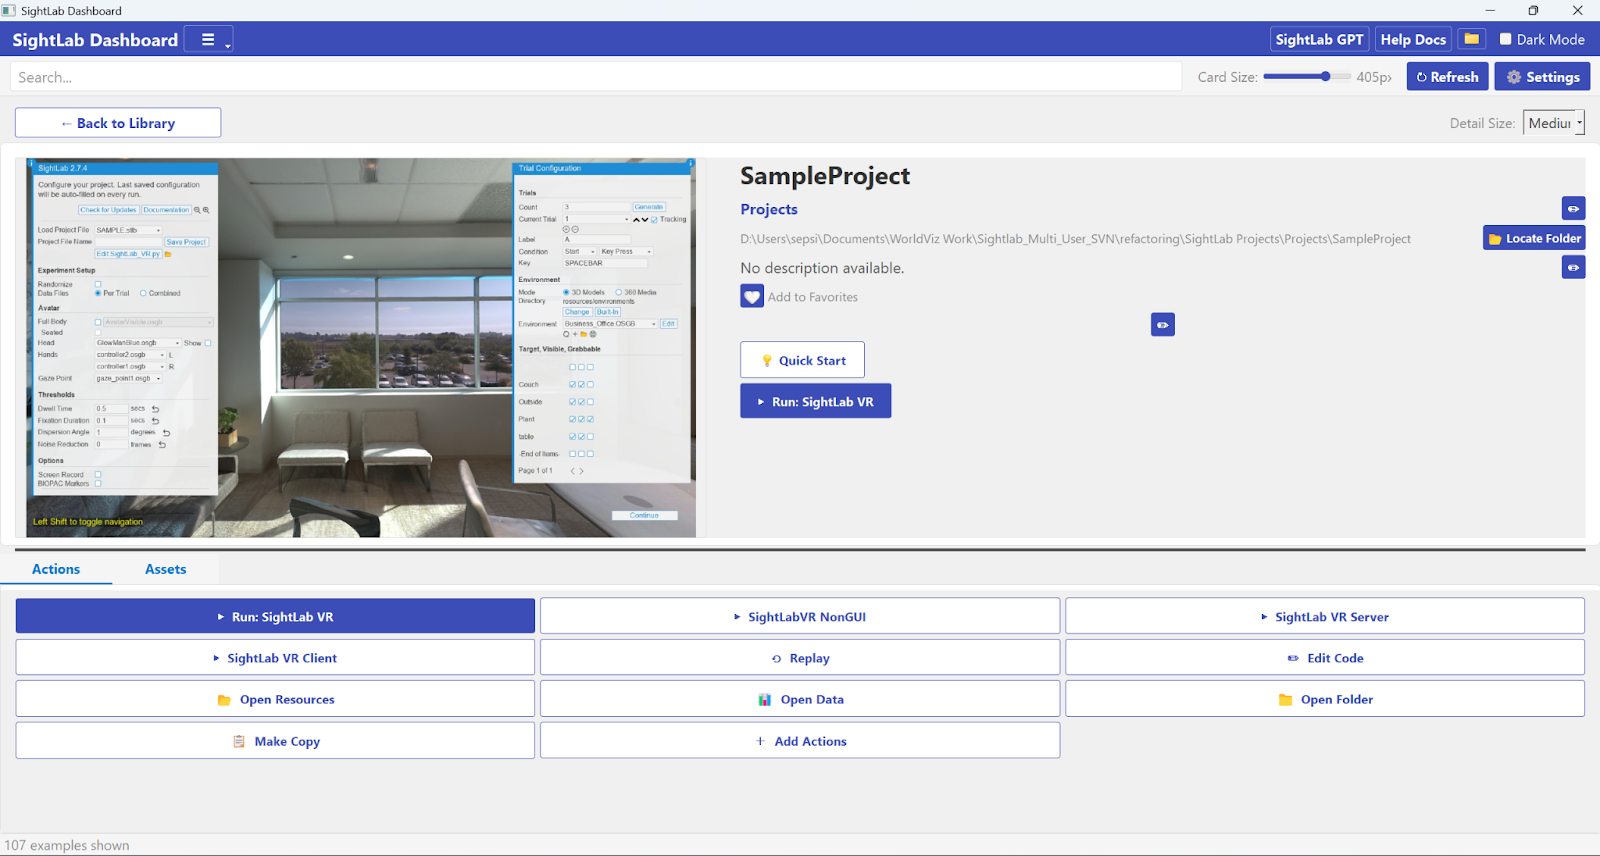
If the card grid is the overview, the Detail Page is where you work more closely with an item. Clicking a card opens a larger view with the thumbnail, metadata, and all available actions in one place.
Some fields are editable. You can update the category, description, tags, and folder path, and you can also mark an item as a favorite with the heart icon. The title itself is not directly editable there, since it comes from the original project or folder name.
The action area can include buttons such as Run, Replay, Config, Edit Code, Open Resources, Open the Data Files, Open the Main Folder, Make Copy, Documentation, Video, and ReadMe. If an example is hosted remotely rather than installed locally, you may see a Download button first. Once downloaded, simply drag and drop the zip into the Dashboard window it then behaves like a normal local example.
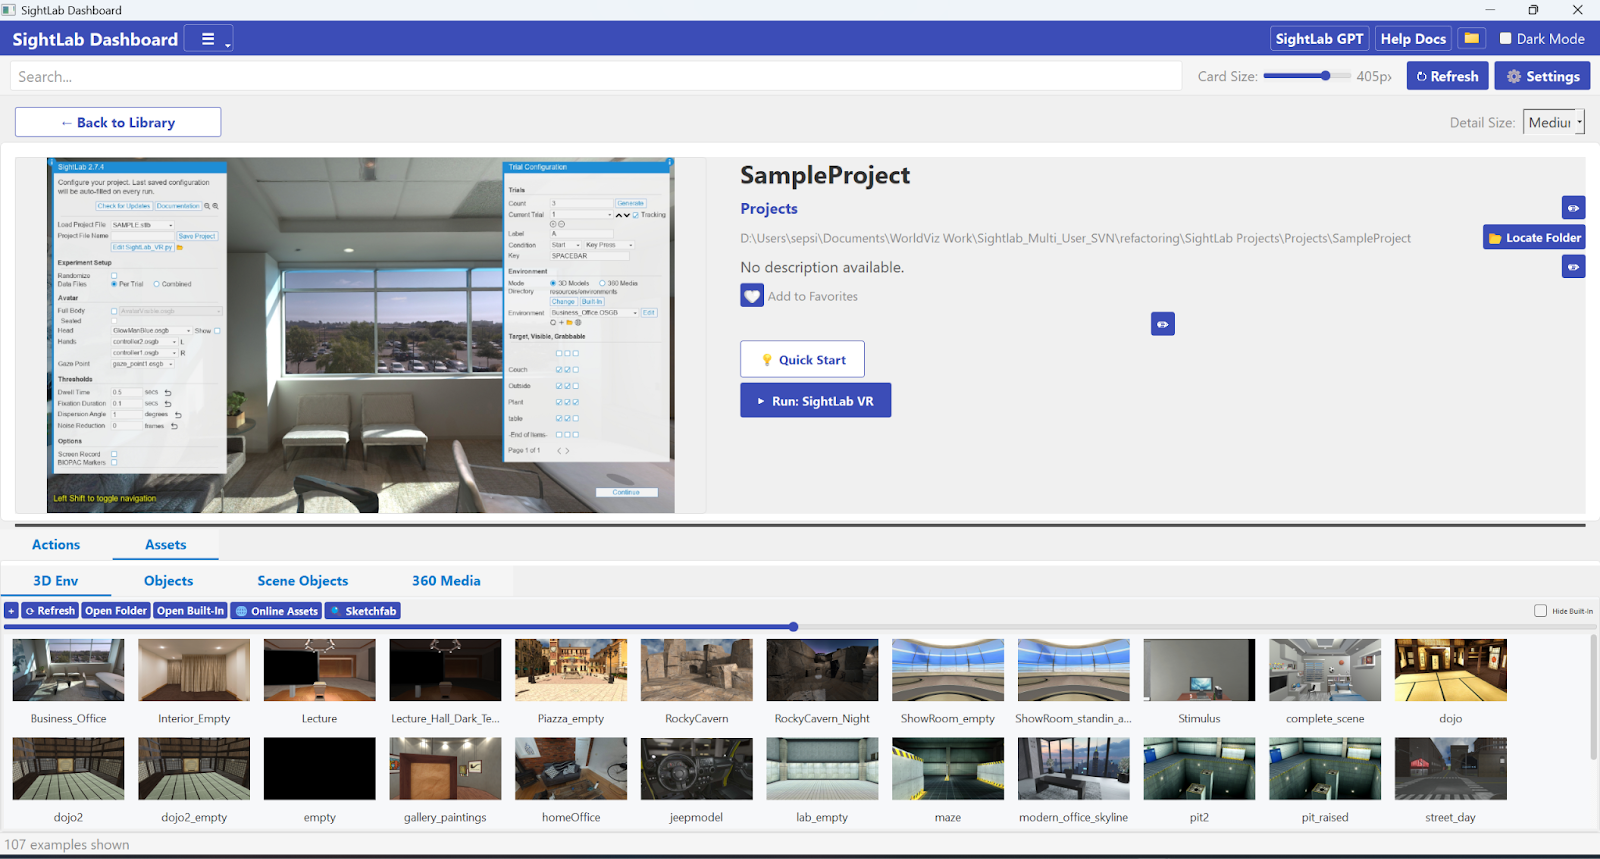
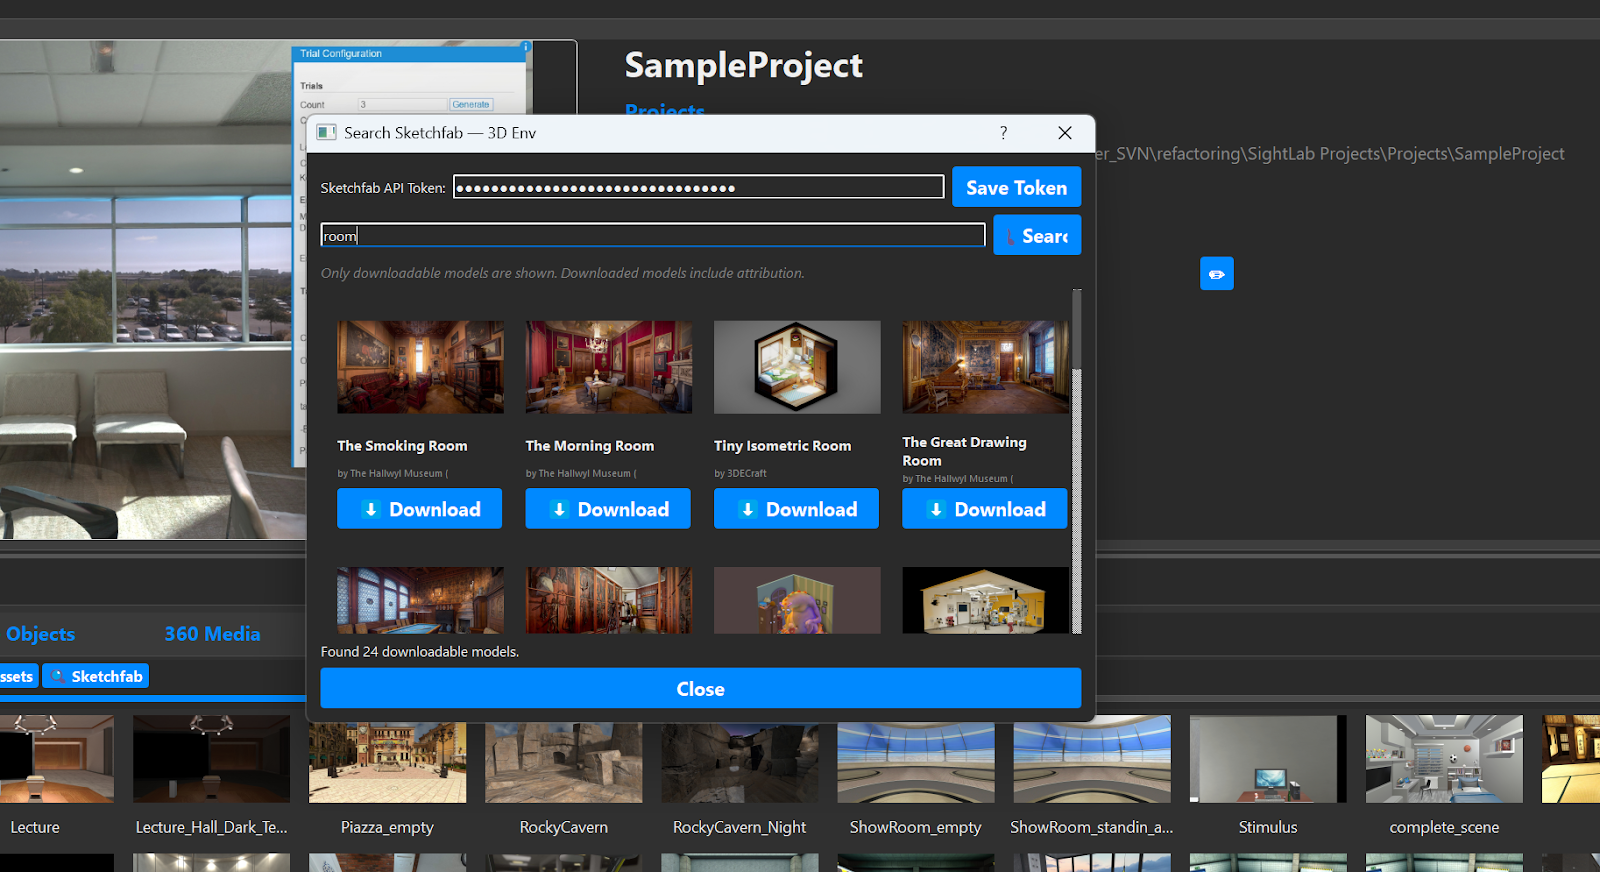
The Detail Page is also where you can refine how content is presented. You can swap thumbnails, update descriptions, add tags for better searching, and even choose which script should be treated as the primary launch target. From here you can also launch Vizard/SightLab scripts embedded and access an Assets library where you can drag and drop assets to build your scene and even access Sketchfab for searching a larger database (after entering your API key)
For most users, the easiest way to begin is to think of the dashboard in three steps:
First, find or create what you want to work on.
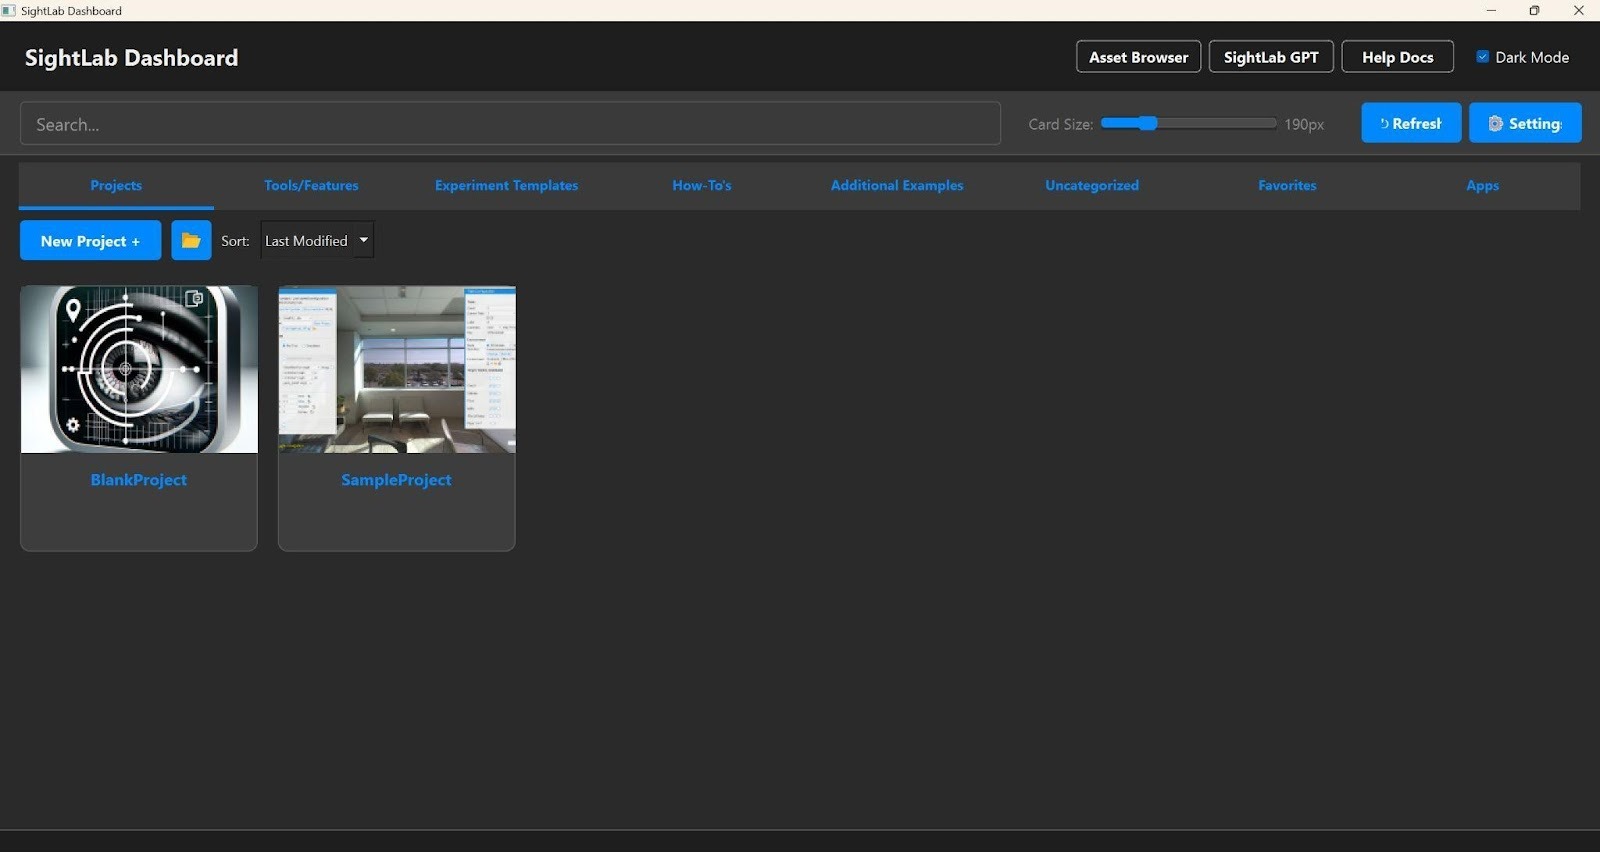
If you are starting fresh, go to the Projects tab and click New Project +. The dashboard creates a copy of the BlankProject template in your projects folder and automatically renames the Python files to match your new project name and allows you to drag and drop assets and edit your experiment. If you are learning or prototyping, browse Experiment Templates or Tools/Features instead.
Second, open the project or example and review its actions.
From the Detail Page, decide whether you want to run it directly, edit the code, open the folder, or look at extra resources like documentation or videos. If there are multiple scripts, you can choose which one should be the primary script and hide others that you do not need to see.
Third, organize it so it is easier to find later.
Add tags, write a better description, assign a category, and mark it as a favorite if it is something you plan to return to. Those small metadata edits make the dashboard much more useful over time, especially in larger labs or shared workspaces.
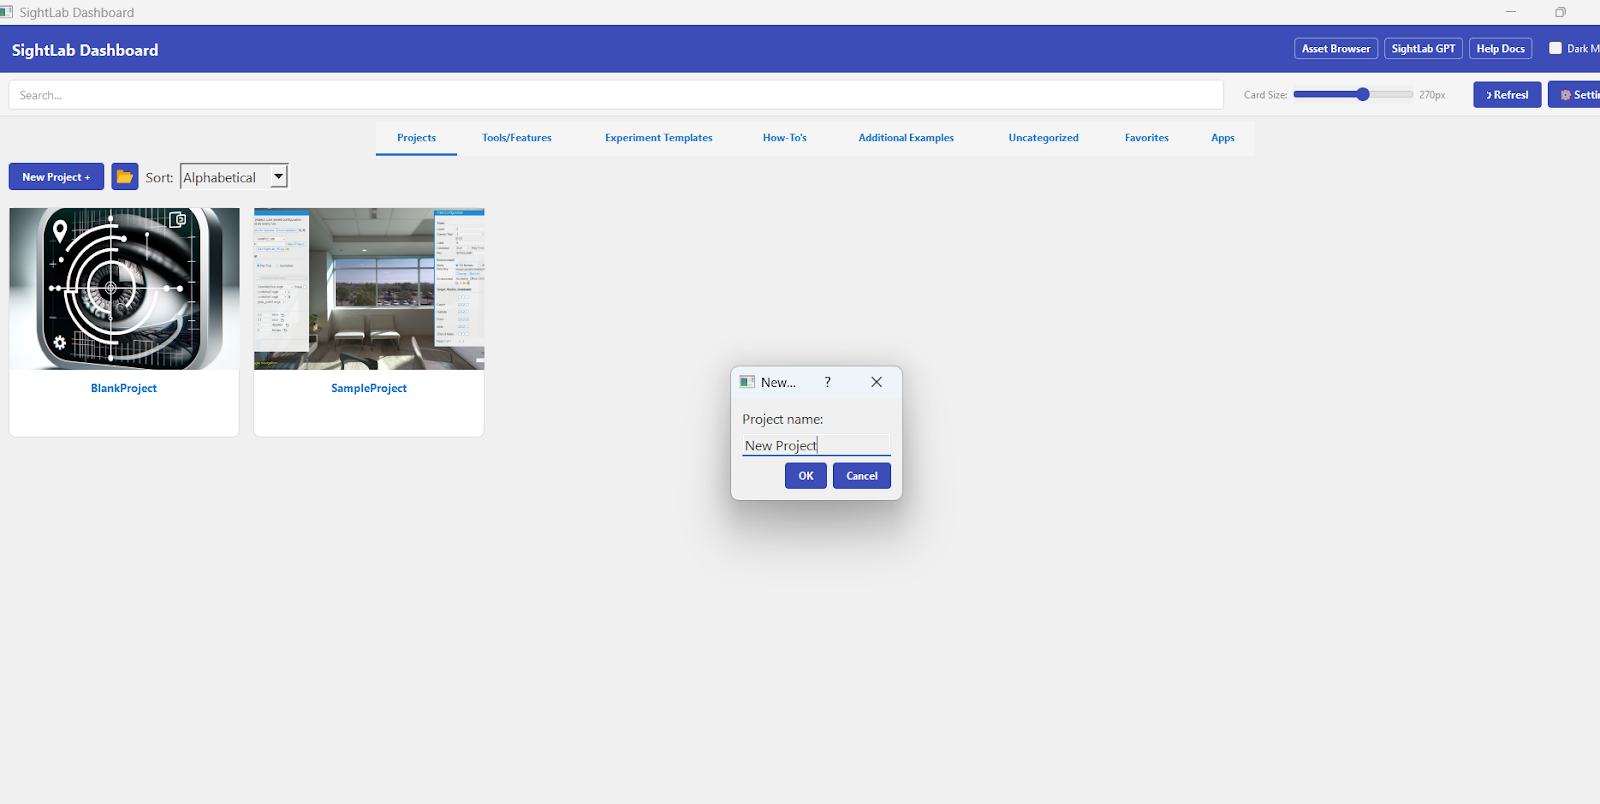
The Projects tab is where your own work lives. New projects are created from the BlankProject template, and project cards can be sorted alphabetically, by last modified date, or by last accessed date. The built-in SampleProject stays pinned at the top.
You can also change where the dashboard looks for projects by opening Settings and selecting a custom Projects Folder. That is helpful if your team stores work on another drive or shared location. Changes refresh automatically, so the new folder contents appear right away.
For project presentation, you can add a custom thumbnail by simply dragging and dropping your asset from the asset browser or by right clicking and choosing “Swap Thumbnail". That gives projects a cleaner, more informative look inside the dashboard. Additionally, you can edit the description and tags.
One of the easiest ways to personalize the dashboard is by using Favorites. Clicking the heart icon on any Detail Page adds that item to the Favorites tab, making it easy to build a quick-access list of commonly used projects, tools, or examples. Favorites can also be exported and imported as JSON, which is useful for backup or sharing a curated set of items with others.
The Apps tab serves as a launcher for companion tools. Built-in shortcuts can include Vizard, Inspector, and E-Learning Lab, and you can add your own custom application shortcuts as well. That means the dashboard is not just for scripts and projects — it can also become your launch point for the wider SightLab workflow.
A big strength of the new dashboard is that it is not static. You can customize how examples and projects appear by editing metadata such as category, description, tags, thumbnail, primary script, hidden scripts, folder location, and more. These settings persist across sessions, which means the dashboard becomes more tailored to the way you work over time.
This is especially useful in environments with lots of scripts. Instead of accepting the default organization, you can gradually turn the dashboard into a cleaner front-end for your own lab’s workflow.
In addition to launching Vizard and SightLab scripts in a separate window, you can also choose to run them embedded if you check that option in the settings. Note that server and client (Multi-User) scripts do not work embedded and must be run in a separate window.

A good way to start using the dashboard is to avoid trying to learn everything at once. Open it, create one project, and then spend a few minutes exploring the Tools/Features and Experiment Templates tabs. Try searching for a keyword related to what you want to build, open the Detail Page for a few examples, and compare the available actions.
It also helps to use metadata early. Adding tags and descriptions may seem minor at first, but it pays off quickly once you have more than a handful of projects and examples. The dashboard search becomes much more useful when your content is clearly labeled.
The new SightLab Dashboard is more than a launcher. It is a practical workspace for discovering examples, creating projects, organizing scripts and assets, launching tools, and keeping your SightLab environment easier to manage. For beginners, it lowers the barrier to getting started. For advanced users, it offers faster navigation and better organization across larger collections of experiments and utilities.
Used well, it can become the main entry point for your whole SightLab workflow.
To see how SightLab +Vizard can help you with your research contact sales@worldviz.com.
To try out SightLab request the trial here: https://help.worldviz.com/sightlab/ (click Request/Trial Download Link).